Futures education
Cumulative delta in futures: calculation, classification and resets
A three-trade example separates the running total from each bar's delta and shows which settings must match when comparing charts.
Cumulative delta adds signed volume over time
Cumulative delta in futures is a running total of volume classified as buying minus volume classified as selling. In an ask-minus-bid calculation, each bar's delta is ask-classified contracts minus bid-classified contracts; the cumulative value adds that result to the previous total until the calculation resets.
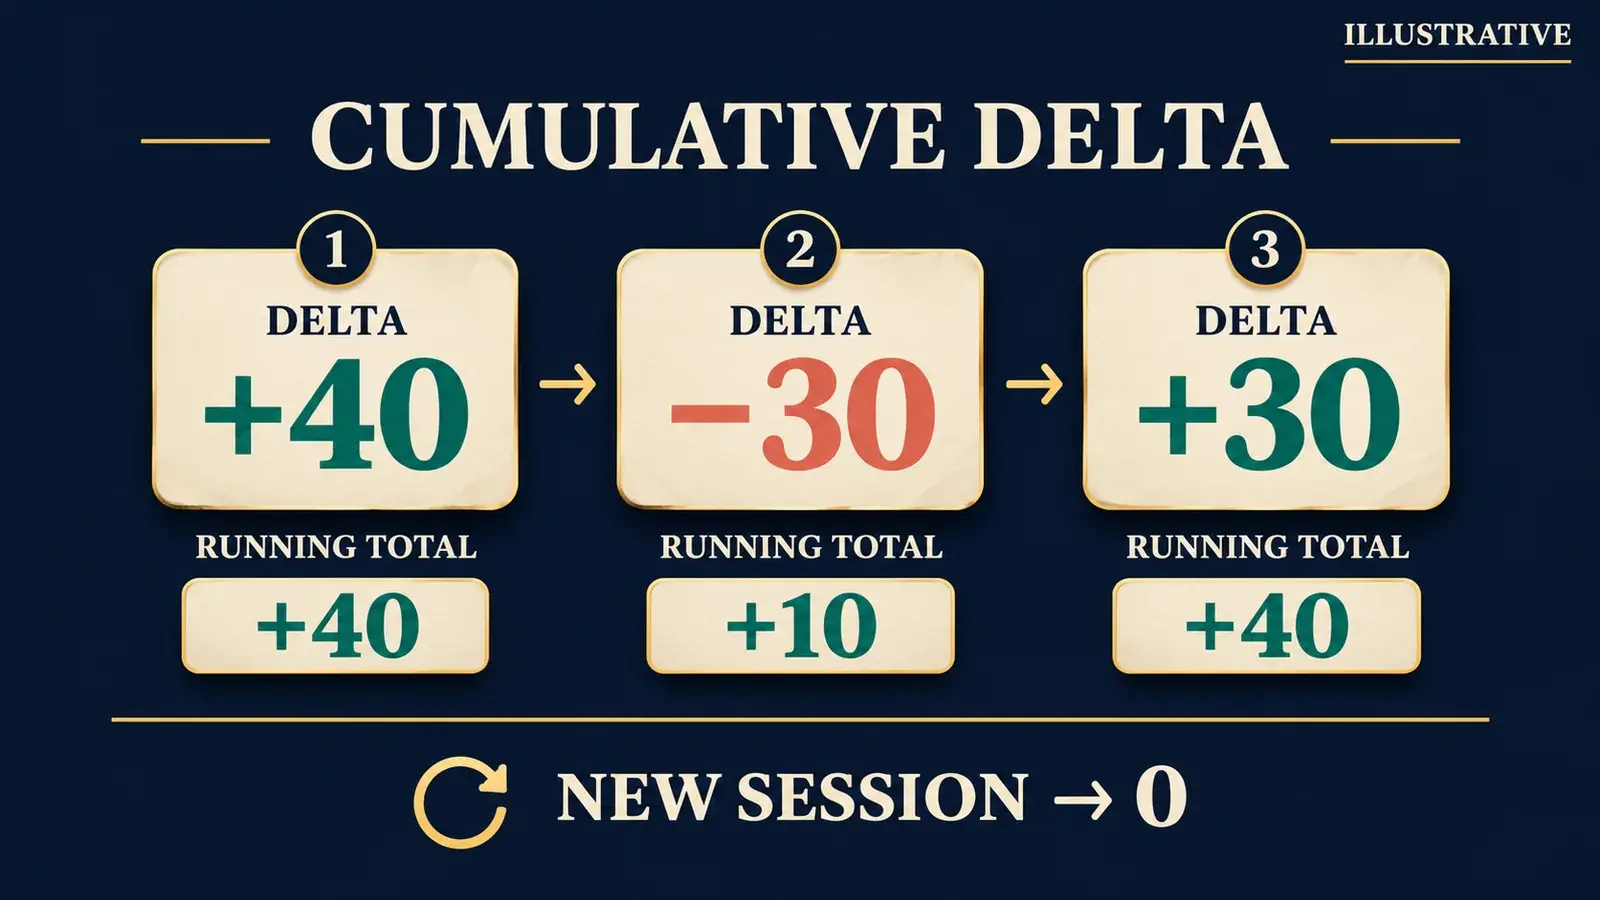
The units are contracts, not dollars or numbers of traders. Every execution has a buyer and a seller. Assigning its volume to one side describes the classification of that execution; it does not count unmatched buyers or sellers. Ordinary volume alone also cannot identify whether a trade opened or closed a position.
Sources: Sierra Chart: Cumulative Delta Bars calculation and chart differences · CME: What futures volume measures
Follow three trades from zero to +40
Assume these invented executions belong to one futures contract month and the same session. To make bar delta and session delta easy to compare, each chart bar contains just the one execution shown. The ask/bid classifications are given, no size filter applies, and the running total starts at zero.
| Bar | Execution | Bar delta | Session total |
|---|---|---|---|
| 1 | 40 contracts at the ask | +40 | +40 |
| 2 | 30 contracts at the bid | −30 | +10 |
| 3 | 30 contracts at the ask | +30 | +40 |
Sources: Sierra Chart: Cumulative Delta Bars calculation and chart differences
A positive total can fall during a selling bar
After all three trades, ordinary volume is 40 + 30 + 30 = 100 contracts. Ask volume is 70 and bid volume is 30, so cumulative delta is 70 − 30 = +40.
Bar 2 contributes −30, but its session total remains positive at +10. A positive CVD reading therefore does not mean the latest bar had positive delta. Compare the total's change, +10 − +40 = −30, with that bar's activity.
Sources: Sierra Chart: Cumulative Delta Bars calculation and chart differences
Check how the indicator assigns the sign
NinjaTrader's Order Flow Cumulative Delta offers Bid Ask and Up Down Tick modes. Their rules can assign different signs to the same execution.
| Method | Positive or negative volume | Unchanged or ambiguous price |
|---|---|---|
| NinjaTrader Bid Ask | At/above ask: positive. At/below bid: negative. | Inside the spread: retain the previous tick's classification. |
| NinjaTrader Up Down Tick | Above previous trade: positive. Below it: negative. | Same trade price: retain the previous tick's classification. |
| TradingView aggregated CVD | A lower-timeframe bar's entire volume is signed by its close versus open. | Equal open/close: compare with the previous intrabar close, then retain its sign if still equal. |
Sources: NinjaTrader: Order Flow Cumulative Delta modes and historical data · TradingView: Cumulative Volume Delta calculation modes and anchor period
The calculation mode can change the result
For example, suppose the previous trade was 101.25 and the current bid/ask is 100.75/101.00. A new 10-contract execution at 101.00 is at the ask but below the previous trade. NinjaTrader's Bid Ask mode adds 10; its Up Down Tick mode subtracts 10. Neither method is counting a different number of contracts.
TradingView's current CVD documentation also describes an optional tick-based mode, off by default. It prioritizes reported aggressor side, then distance to bid/ask, then tick-price direction when needed. Availability depends on the symbol and tick-data access; both the chart timeframe and CVD anchor period must be 1D or shorter. Check the displayed method; do not assume every TradingView CVD reading uses the aggregated estimate.
Sources: NinjaTrader: Order Flow Cumulative Delta modes and historical data · TradingView: Cumulative Volume Delta calculation modes and anchor period
A reset changes the baseline, not the executed trades
In NinjaTrader, Session carries each delta close into the next bar; Bar starts each bar at zero. TradingView uses an anchor period and restarts the accumulation when that period changes.
Suppose the example's session ends at +40. In the next session, a bar has 40 ask-classified and 60 bid-classified contracts: its delta is −20. A new session total starting at zero becomes −20. A calculation that deliberately continues from the earlier +40 becomes +20. The difference of 40 contracts comes entirely from the starting total.
Sierra Chart also warns that a calculation running from the beginning of loaded chart data can change after reloading if that start time changes. Match the reset setting and starting range before interpreting a difference as new buying or selling.
Sources: NinjaTrader: Order Flow Cumulative Delta modes and historical data · TradingView: Cumulative Volume Delta calculation modes and anchor period · Sierra Chart: Cumulative Delta Bars calculation and chart differences
Resolve chart differences before reading divergence
Compare the same contract month, data feed, classification mode, session times, time zone, reset period and any volume filter. If comparing individual bars, also match how those bars are formed. A matching indicator name is not enough.
Historical inputs matter. NinjaTrader's Bid Ask mode requires historical ticks stamped with bid/ask information. Sierra Chart requires historical Bid Volume and Ask Volume; without it, disconnected periods can appear flat or zero. A flat line with missing history is not evidence that buying and selling were balanced. Sierra recommends tick-by-tick storage for its highest accuracy.
If price makes a higher high while CVD does not, that is a disagreement between price and the selected signed-volume measure over that interval. It does not establish who opened or closed positions, nor prove that price must reverse. First rule out different resets, classification and missing data.
Sources: NinjaTrader: Order Flow Cumulative Delta modes and historical data · Sierra Chart: Cumulative Delta Bars calculation and chart differences · CME: What futures volume measures