Futures education
Futures volume profile: POC, value area and session choices
A worked distribution shows which differences come from the trades and which come from chart settings.
Read traded quantity at each price
A futures volume profile groups traded contracts by price over a selected period. Longer horizontal rows represent more volume at that price or price band. This is a record of executions, not the quantities currently waiting in the order book.
Count contracts, not trade events: one execution for 20 contracts contributes 20 to volume. The matched buyer and seller do not make that 40. A profile also does not identify whether those contracts opened or closed positions.
Sources: Sierra Chart: Volume by Price and profile differences · CME: What futures volume counts
A 100-contract profile and its point of control
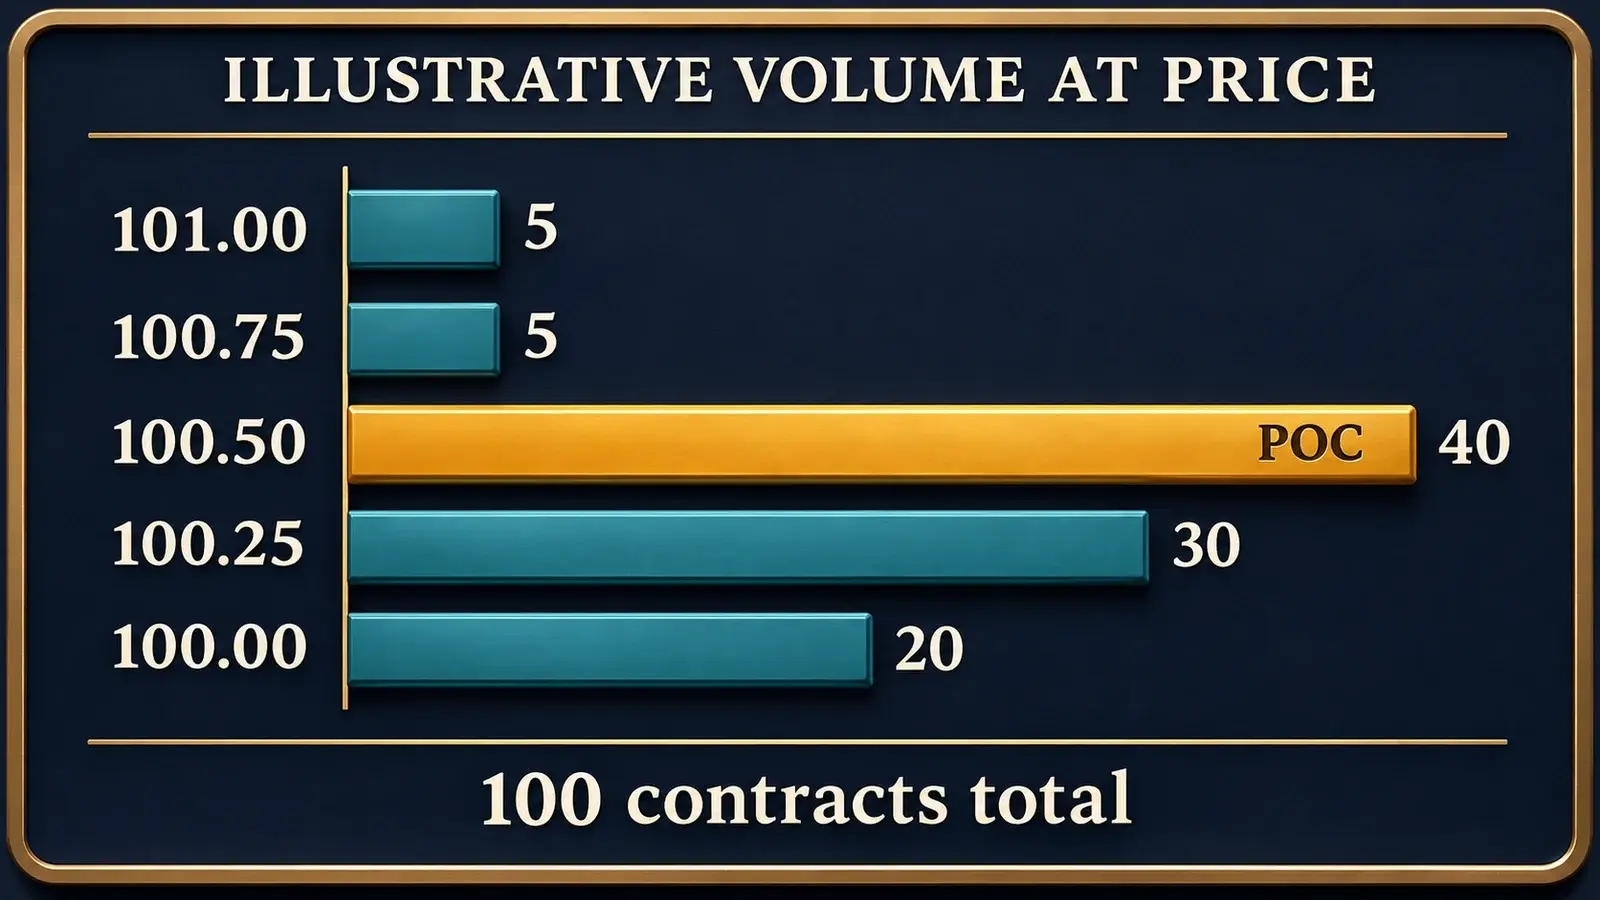
These invented quantities belong to one futures contract month with a 0.25 price increment. Each row initially represents one price. Session A contains 100 contracts of traded volume; Session B is a separate later session. Prices and quantities are illustrative.
The point of control, or POC, is the row with the most volume. In Session A it is 100.50, with 40 contracts. It is not necessarily the last traded price.
| Price | Session A | Session B | A + B |
|---|---|---|---|
| 101.00 | 5 | 10 | 15 |
| 100.75 | 5 | 50 | 55 |
| 100.50 | 40 | 0 | 40 |
| 100.25 | 30 | 0 | 30 |
| 100.00 | 20 | 0 | 20 |
| Total contracts | 100 | 60 | 160 |
Sources: NinjaTrader: Order Flow Volume Profile settings · CME: What futures volume counts
Value area depends on the selected percentage and method
The value area is a range built around a selected share of the profile's volume. Its upper and lower boundaries are VAH and VAL. The percentage is configurable: TradingView documents 70% as its default, while NinjaTrader's Order Flow Volume Profile documents 68%. Match the setting and calculation method before comparing boundaries.
For Session A, a 70% target is 100 × 0.70 = 70 contracts. Following TradingView's documented row-expansion method, start with the POC's 40, then compare the adjacent rows: 30 below versus 5 above. Adding the 30 reaches 70 exactly. With one price per row, this example has VAL at 100.25 and VAH at 100.50.
That percentage describes the selected historical volume. It is not a 70% probability that a future trade will remain inside the area.
Sources: TradingView: Volume profile calculations and value area · NinjaTrader: Order Flow Volume Profile settings
Changing the period changes the question
Combining the two sessions above produces 160 contracts. The largest row moves to 100.75 because 5 + 50 = 55, exceeding the 40 at 100.50. The Session A POC has not been corrected; the combined profile answers a different question.
A session profile uses defined trading hours; a composite combines a selected range. A visible-range profile can change when you scroll because the included bars change. Record the contract month, dates, session boundaries and time zone before comparing screenshots. Check that the chart actually loaded the entire requested period.
A profile still accumulating trades can change its POC and value-area boundaries. Compare completed periods, or label the observation time when using a developing profile.
Sources: NinjaTrader: Order Flow Volume Profile settings · Sierra Chart: Volume by Price and profile differences
Wider price rows can move the largest row
Row size is a separate choice from the profile's time period. For the Session A example, group adjacent prices into two-tick rows beginning at 100.00: the 100.00/100.25 row contains 20 + 30 = 50 contracts; the 100.50/100.75 row contains 40 + 5 = 45; the 101.00/101.25 row contains 5 + 0 = 5.
The largest row is now the lower 100.00/100.25 band, even though the underlying trades have not changed. Total volume remains 100. Check the number of ticks per row and the row boundaries before treating a changed POC as new market activity.
Sources: Sierra Chart: Volume by Price and profile differences
Check how the platform builds the distribution
A chart's displayed bar interval does not tell you the resolution used to build its profile. NinjaTrader's Minute resolution distributes each one-minute bar's volume evenly across prices between its high and low; Tick resolution uses individual trade data. TradingView builds profiles from lower-timeframe data, with the chosen timeframe depending on the profile tool.
Color labels need checking too. TradingView's up/down volume classifies lower-timeframe bars by their close relative to their open. It is not a count of distinct buyers and sellers or the same measurement as bid/ask-classified executions.
Before comparing profiles, match the symbol, loaded history, session, row size, volume type and calculation resolution. A volume profile, a trade-count profile and a time-at-price profile can look similar while counting different things. A large historical row alone does not establish buying intent or guarantee a bounce.
Sources: NinjaTrader: Order Flow Volume Profile settings · TradingView: Volume profile calculations and value area · Sierra Chart: Volume by Price and profile differences · CME: What futures volume counts