Futures education
How to read a USDA WASDE balance sheet
The USDA’s monthly World Agricultural Supply and Demand Estimates (WASDE) report shows how much of a crop is expected to be available, how much will be used and what will carry into the next marketing year. To read a revision, compare two forecasts for the same crop year and follow both supply and use.
Find the two forecasts for the same crop year
On page 12 of USDA’s November 10, 2026 report, go to the U.S. corn table below the feed-grains table. Read the two columns labeled 2026/27, one for October’s projection and one for November’s. Both cover U.S. corn from September 1, 2026 through August 31, 2027. The adjacent 2025/26 column covers a different harvest.
Check the unit beside the rows you are using. The feed-grains table above reports quantities in million metric tons. The corn table reports acreage in millions of acres, yield in bushels per harvested acre, and supply, use and stocks in millions of bushels.
Sources: USDA WASDE-677, November 10, 2026 (page 12) · USDA ERS Feed Grains Database documentation · USDA World Agricultural Supply and Demand Estimates
Rebuild November’s balance without counting ethanol twice
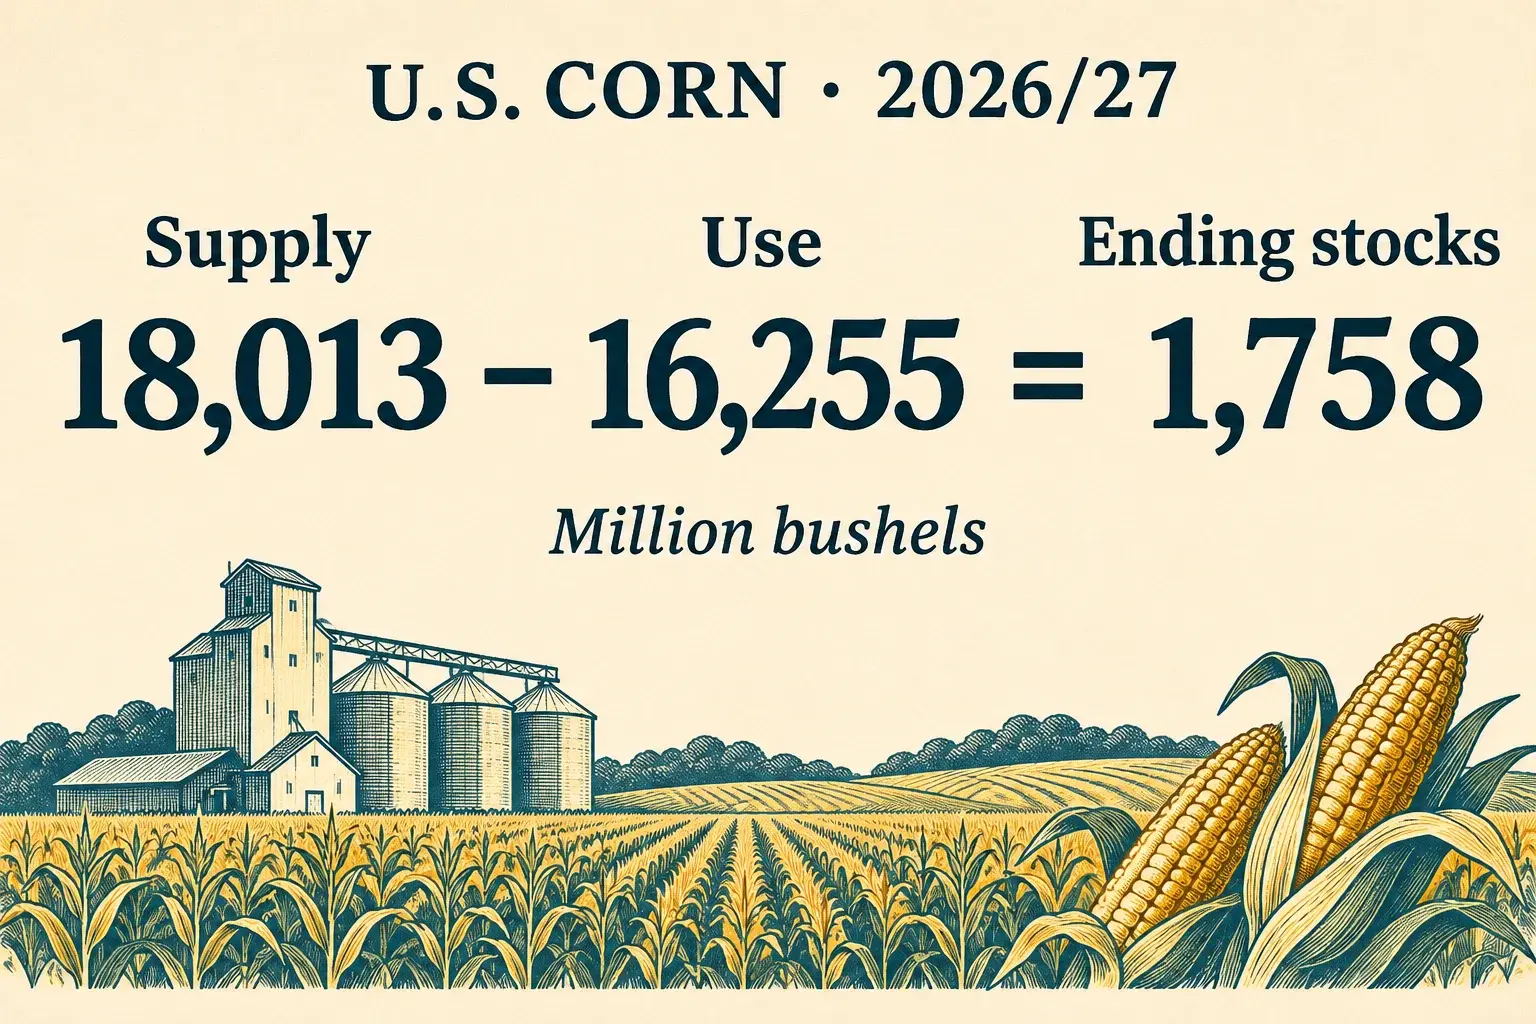
Start with the corn carried in from the previous year. USDA’s estimated 2025/26 ending stocks of 2,095 million bushels become 2026/27 beginning stocks. Add November’s projected production of 15,893 and imports of 25 to get total supply of 18,013 million bushels.
On the use side, feed and residual use of 5,975 plus food, seed and industrial use of 7,005 gives domestic use of 12,980 million bushels. The indented 5,650 for ethanol and by-products is already part of the 7,005. Adding that line again would overstate use by 5,650 million bushels.
Add exports of 3,275 to domestic use to get total use of 16,255 million bushels. That leaves 18,013 − 16,255 = 1,758 million bushels in projected ending stocks for August 31, 2027.
Sources: USDA WASDE-677, November 10, 2026 (page 12) · USDA ERS Feed Grains Database documentation
Why a 141-million-bushel crop cut reduced stocks by 91 million
USDA kept harvested corn area at 88.5 million acres and cut expected yield from 181.2 to 179.6 bushels per acre. Production fell by 141 million bushels. Beginning stocks and imports held steady, so total supply fell by the same amount.
USDA also reduced feed and residual use by 25 million bushels and exports by 25 million. That left 50 million more bushels available than if use had stayed at October’s projection. The change in ending stocks was therefore −141 − (−50) = −91 million bushels.
| U.S. corn, million bushels | October | November | Change |
|---|---|---|---|
| Total supply | 18,154 | 18,013 | −141 |
| Total use | 16,305 | 16,255 | −50 |
| Ending stocks | 1,849 | 1,758 | −91 |
Sources: USDA WASDE-677, November 10, 2026 (page 12) · USDA ERS Feed Outlook, November 2026
Calculate how much inventory remains relative to annual use
Divide ending stocks by total use for the same crop year and multiply by 100. October’s stocks-to-use ratio was 1,849 ÷ 16,305 × 100 = 11.3%. November’s was 1,758 ÷ 16,255 × 100 = 10.8%, rounded to one decimal place. USDA expected about 10.8 bushels to remain at year-end for every 100 bushels used domestically or exported during the year.
The ratio puts inventory in context, but it cannot give you a futures price. In this same update, USDA lowered its projected season-average farm price from $4.70 to $4.60 per bushel even as the ratio fell. That line estimates the marketing-year weighted average price received by farmers. A December corn futures quote prices a specific delivery contract.
Sources: USDA WASDE-677, November 10, 2026 (page 12) · USDA ERS Feed Outlook, November 2026