Futures education
Futures VWAP: calculation, bar data and session resets
A three-trade example separates volume weighting from chart-data and session choices.
VWAP weights each price by contracts traded
Futures VWAP, or volume-weighted average price, is the sum of each trade's price multiplied by its contract quantity, divided by total contracts traded over the selected period. A 60-contract execution has six times the weight of a 10-contract execution.
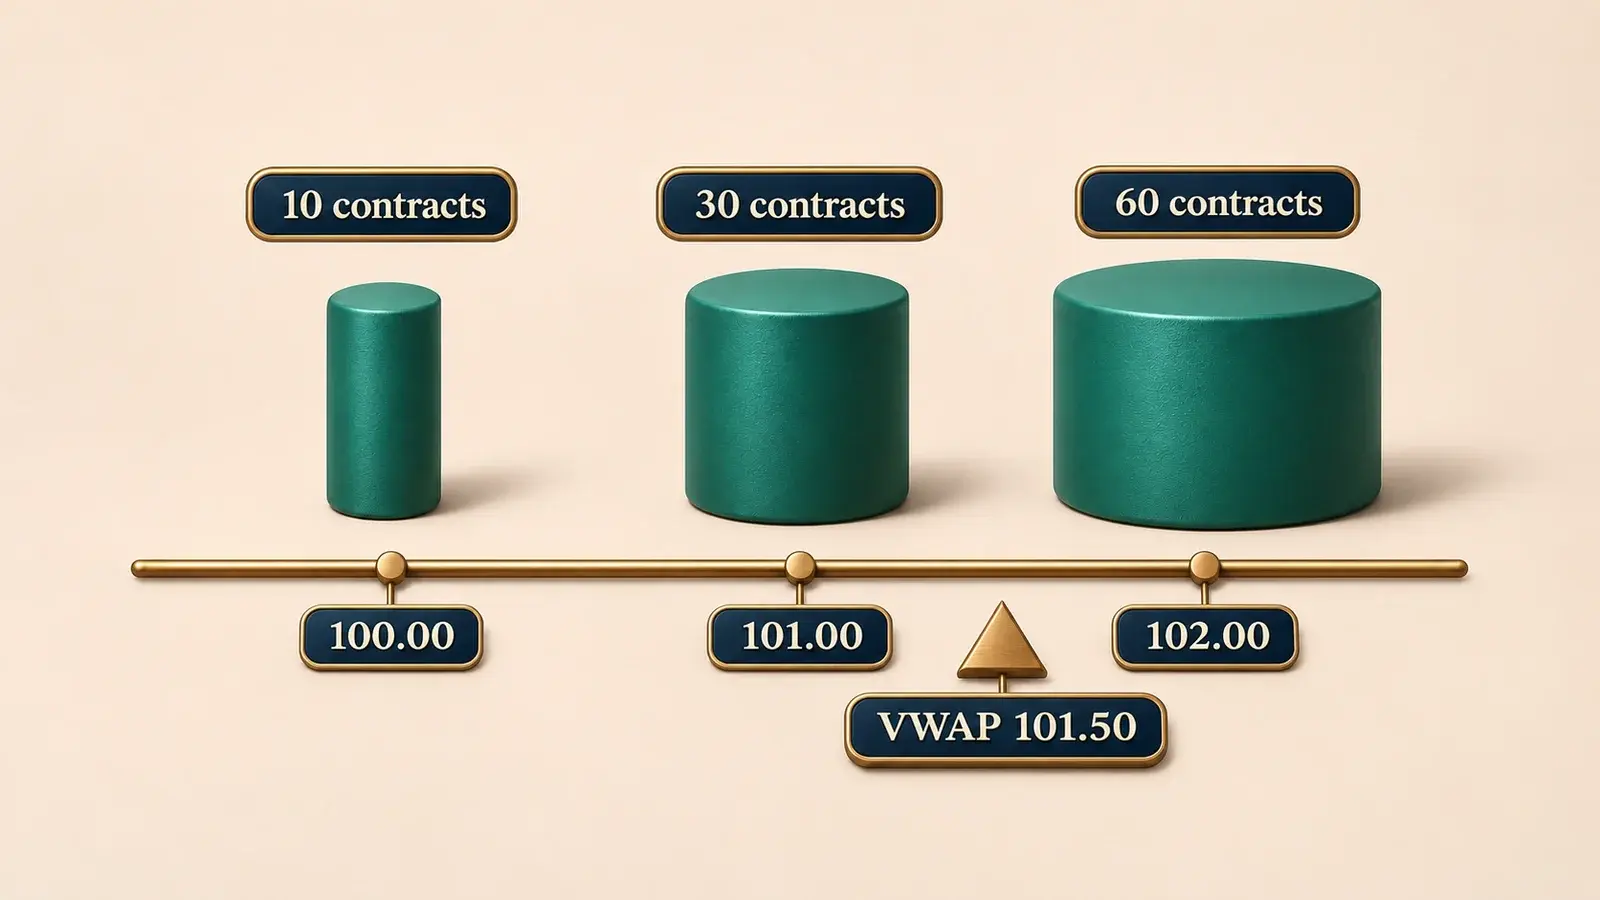
VWAP = sum of (price × contracts) ÷ sum of contracts. Use the same futures contract month and measurement window throughout. The result is a price, not a dollar profit or a count of traders. Count each matched contract once; its buyer and seller do not double the volume.
Sources: NinjaTrader: Order Flow VWAP calculation, reset intervals and resolution · Sierra Chart: VWAP inputs and differences between chart intervals · CME: What futures volume counts
Three trades produce a VWAP of 101.50
Assume these are the only three executions in a selected window, in the order shown. Prices and quantities are invented; all belong to the same futures contract month.
The total price × quantity is 1,000 + 3,030 + 6,120 = 10,150, and volume is 100 contracts. VWAP is therefore 10,150 ÷ 100 = 101.50. The unweighted average of the three execution prices is (100 + 101 + 102) ÷ 3 = 101.00. More volume traded at the higher price, so the weighted average is higher.
| Execution | Price | Contracts | Price × contracts |
|---|---|---|---|
| 1 | 100.00 | 10 | 1,000 |
| 2 | 101.00 | 30 | 3,030 |
| 3 | 102.00 | 60 | 6,120 |
| Total | — | 100 | 10,150 |
Sources: NinjaTrader: Order Flow VWAP calculation, reset intervals and resolution · Sierra Chart: VWAP inputs and differences between chart intervals
A bar summary can give a different answer
A chart indicator may weight a representative price for each bar instead of every individual execution. TradingView's documented default uses HLC3: (high + low + close) ÷ 3, multiplied by that bar's volume, with cumulative price-volume divided by cumulative volume.
If the three example trades form one bar, its high is 102, low is 100 and close is 102. HLC3 is (102 + 100 + 102) ÷ 3 = 101.3333…. With only that bar in the calculation, the bar-based VWAP is about 101.33, compared with the trade-level 101.50. The high, low, close and total volume do not retain how much volume traded at each price.
Changing the chart interval can change those representative prices. Check the indicator's input source and calculation resolution before treating a difference between charts as a data error.
Sources: TradingView: VWAP formula, source and anchor period · Sierra Chart: VWAP inputs and differences between chart intervals
Resetting the window changes which trades count
A session reset discards the prior period's accumulated price-volume and volume. It does not mean the new VWAP price is zero: the first included trade or bar establishes the new average. The session boundary comes from the configured trading hours, which need not be calendar midnight.
Suppose an earlier overnight window contained 100 contracts, all at 99.00, followed by the three example trades during a later daytime window. The daytime-only VWAP is 101.50. Including both windows gives (9,900 + 10,150) ÷ (100 + 100) = 100.25. Both calculations use the same daytime executions; they answer different questions.
In NinjaTrader Order Flow VWAP, Session, Week and Month are reset choices. Tick resolution is available for Session, but not Week or Month. Its trading-hours setting also works with the selected data series' hours; the indicator does not calculate outside those hours.
Sources: NinjaTrader: Order Flow VWAP calculation, reset intervals and resolution · Sierra Chart: VWAP inputs and differences between chart intervals
Match the inputs before comparing VWAP lines
Sierra Chart's VWAP study can use the underlying intraday data instead of chart-bar prices. Its documentation recommends tick-by-tick data for the greatest detail. Even then, matching values across chart intervals requires the calculation's first bar to start at the same time; non-time-based bars can cross boundaries differently.
TradingView also warns against a Session anchor on a one-day chart: the calculation resets on every bar instead of accumulating several bars within the period.
- Symbol and history: compare the same contract month, feed and loaded date range. A calculation missing part of the selected window uses a different sample.
- Window: match the reset period, trading-hours template, time zone and observation time. Include or exclude overnight trading consistently.
- Inputs: match trade-level versus bar-based calculation, the selected bar price such as HLC3 or close, and total versus any bid-only or ask-only volume setting.
Sources: Sierra Chart: VWAP inputs and differences between chart intervals · TradingView: VWAP formula, source and anchor period · NinjaTrader: Order Flow VWAP calculation, reset intervals and resolution
Above or below VWAP describes a price comparison
In the example, the last trade at 102.00 is 0.50 above the window's VWAP of 101.50. That statement compares a price with a historical average; it does not show the average cost of positions still open. Executed volume can include both opening and closing trades.
The calculation also does not establish that the next price must return to 101.50. Use the chosen window and inputs to define what the benchmark measures before interpreting a crossing as a trading signal.
Sources: Sierra Chart: VWAP inputs and differences between chart intervals · CME: What futures volume counts